How long a losing streak is normal at your win rate
10 min read
You have lost six in a row. The setups looked the same as the ones that worked last month, you followed the rules, and the account is down. Now you have to answer a question you have no data for: is the strategy broken, or is this what your win rate looks like on a bad stretch?
Most traders answer it with their gut, and the gut has exactly one answer — something is wrong, change something. The math gives a better answer, and it takes about ten minutes to work out.
A losing streak is a prediction, not a surprise
If your strategy wins 45% of the time, then every trade is a coin weighted 55% toward a loss. Six losses in a row is that coin landing the same way six times. The probability of that happening on any given run of six trades is:
0.55 × 0.55 × 0.55 × 0.55 × 0.55 × 0.55 = 0.0277
About 2.8%. That number looks small, and it is the number most traders stop at — which is why they conclude something must be wrong.
But you do not take six trades. You take hundreds. The question is not "what were the odds of this six", it is "what were the odds that a run of six shows up somewhere in my last 100 trades". That is a different number, and it is much bigger: 73%.
At a 45% win rate, over 100 trades, a six-loss streak is more likely to happen than not. Under an independent Bernoulli model with a stable win rate, that streak is consistent with ordinary variance — it does not by itself prove the strategy's edge is intact or broken.
What your win rate actually predicts
Here is the same calculation across the win rates most retail strategies land in. All figures assume 100 trades and independent outcomes — an assumption worth taking seriously, and one I come back to at the end.
Typical longest losing streak is the modal (most probable) length of the longest run of consecutive losses in a 100-trade sample under that model, rounded to the nearest whole trade. The remaining columns are the probability that at least one streak of that length or longer appears somewhere in those 100 trades.
| Win rate | Typical longest losing streak in 100 trades | Chance of 5+ in a row | Chance of 8+ in a row | Chance of 10+ in a row |
|---|---|---|---|---|
| 35% | 9 | 99% | 69% | 37% |
| 40% | 7 | 98% | 49% | 21% |
| 45% | 6 | 92% | 31% | 10% |
| 50% | 6 | 81% | 17% | 4% |
| 55% | 5 | 65% | 8% | 2% |
| 60% | 4 | 46% | 4% | 1% |
Read the row that matches your strategy, not the row you wish matched it. A trend-following system taking 2R and 3R targets often sits at 35–40%, and at 40% an eight-loss streak inside a hundred trades is roughly a coin flip (49% in the table). That outcome fits the model; it is not automatic proof that nothing is wrong.
The uncomfortable implication runs the other way too. If you are trading a 40% win rate system and you have never had a losing streak longer than four, you probably do not have enough trades yet to be judging the strategy at all.
The worked example: profitable, and still six down
Take a strategy with a 45% win rate that risks 1R and targets 2R. Expectancy per trade:
(0.45 × 2R) − (0.55 × 1R)
= 0.90R − 0.55R
= +0.35R per trade
That is a genuinely good edge. Over 100 trades it expects +35R. Risking 1% of the account per trade, that is a meaningful year.
Now run the six-loss streak through it. Six losses at 1R each is −6R. At 1% risk per trade, compounding down:
0.99^6 = 0.9415 → −5.85% of account
So a strategy expecting +35R over the sample spends part of that sample nearly 6% underwater, and there is a 73% chance it happens at least once. Push it further: at this win rate there is still a 10% chance of a ten-loss streak in 100 trades, which is −10R and roughly a 9.6% account drawdown.
A 10% drawdown feels like failure. In this strategy it is a one-in-ten event under the assumed model — consistent with variance, but not proof on its own that the edge still holds.
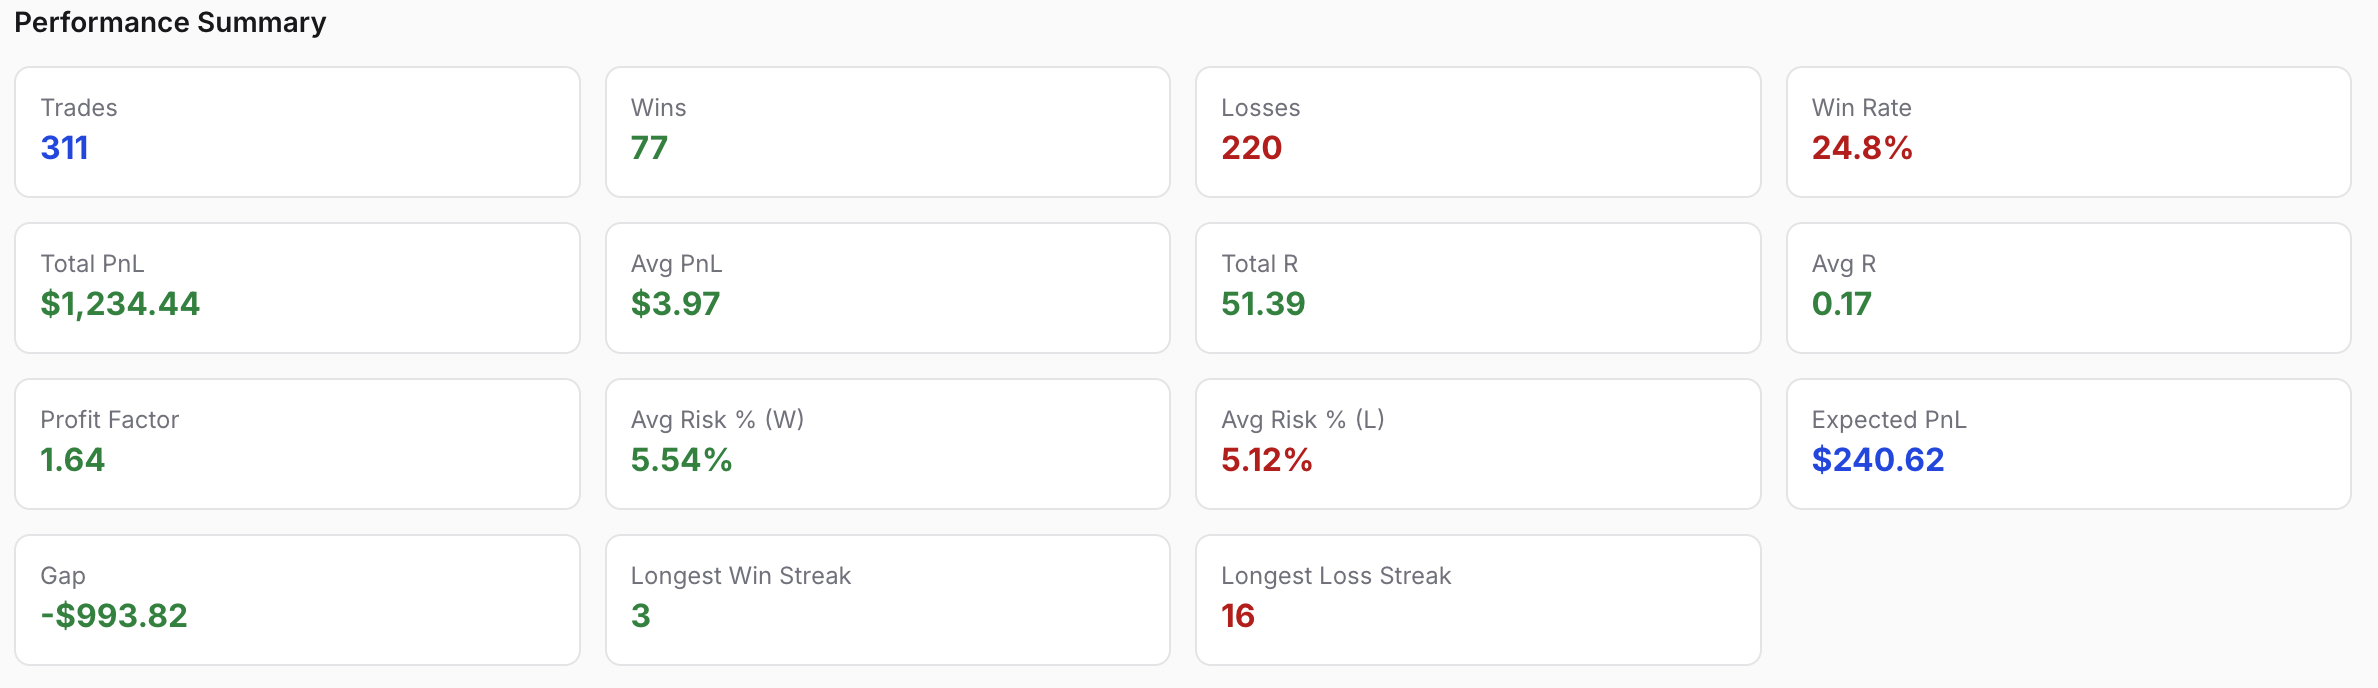 I've been using SMC strategy for a while now, and it's profitable. I didn't know it is until I checked the stats. With this strategy I have 1.90 profit factor despite I had a really long 16 loss streak. I did not change anyhing, did not cut the size or stop trading. But confidence comes from data and it is very releiving seeing you're still profitable just stick to the rules.
Streaks and drawdowns are not the same thing
This is where the streak math quietly misleads people. Your worst drawdown is almost never your longest streak.
Consider two sequences of ten trades, same 40% win rate (four wins, six losses), same 2R target, same +2R net:
- Sequence A: six losses, then four wins. Streak of 6. Net: −6R + 8R = +2R.
- Sequence B: L L L W L L W L W W. Longest streak of 3. Net: −6R + 8R = +2R.
Same win count, same net result, very different peak-to-trough paths. Sequence B never produced a scary streak; Sequence A produced the streak everyone panics about. The difference is outcome ordering, not how many wins you booked.
Counting consecutive losses is a poor proxy for damage. What actually hurts is peak-to-trough equity decline, and that depends on how wins and losses interleave, not on the longest run of one of them. If you are only tracking "how many in a row", you are watching the wrong number.
The practical fix is to stop guessing at the shape of your own equity curve and generate it. Feed your win rate, reward-to-risk, and trade count into the Monte Carlo simulator and it will produce the distribution of outcomes your parameters imply — including how deep the drawdowns get across hundreds of simulated runs, not just the one run you happen to be living through. When you have seen a thousand versions of your own next hundred trades, the version you are currently in stops feeling like evidence.
Three checks that separate variance from a broken strategy
When the streak arrives, run these in order. They take one sitting with your journal.
1. Is the streak inside the expected range? Use the table above, or the simulator, with your actual win rate from your actual logged trades. If your longest streak is at or under the typical value for your win rate, the streak alone is consistent with the model — it does not prove the edge is intact. If it is well past that typical length, or into the range where the "Chance of 10+ in a row" column is no longer tiny for your win rate, you have a reason — not yet a conclusion — to look harder.
2. Did your execution change before the streak, or during it? This is the check that finds most real problems, and it is the one a spreadsheet rarely answers. Compare the streak trades against your previous fifty on things you can actually measure: average risk per trade, number of trades per day, how many setups were A-grade versus marginal, whether your checklist was completed. A strategy that "stopped working" is very often a trader who started taking B-setups after the second loss, or doubled size on trade four to make it back. That shows up in the data as a change in your inputs, not in the market's behaviour.
3. Did the strategy's conditions change? Slice the trades. Compare R-multiple distribution — not P&L — between the streak and the sample before it, split by pair, by session, by setup type. If the losses cluster in one instrument or one session while everything else holds, you have not found a broken strategy. You have found one context where it stopped fitting, which is a much smaller and much more fixable problem.
For me, the third helped a lot to understand what's happening. I checked my R-multiple and how much I was risking per trade. This showed me an inconsistency in my strategy so I fixed it. Same strategy but consistent risk amount made me from loosing trader to a profitable one.
If all three come back clean, the honest conclusion is that the streak is consistent with your assumed model and does not by itself justify changing the strategy. That is a legitimate answer, and it is the hardest one to accept while you are down. It still does not prove the edge remains intact — only that this streak failed to disprove it.
Decide your stop-rule before you need it
The worst time to decide how much drawdown you will tolerate is while you are in it. Set the threshold in advance, in R, from the distribution your own parameters produce — not from how the last week felt.
A rule that survives contact with a bad month has three parts:
- A trigger, expressed in R or percent of account, set past the range your simulation says is ordinary. If your parameters routinely produce 10R drawdowns, a 6R trigger will stop you out of a working strategy roughly every time.
- A response that is not "stop forever", because the response you will actually follow is a smaller one. Cutting risk per trade in half while you take the next twenty trades keeps you in the sample and reduces additional loss during those trades. Your risk-per-trade number is arithmetic, not judgement — the position sizing tool will give you the exact size from your balance, risk percent, and stop distance.
- A review condition, written down: what you will look at, and what result puts you back at full size.
Written before the drawdown, this is a risk rule. Invented during one, it is a panic reaction with a number attached.
What this math cannot tell you
Every number above rests on assumptions that are convenient rather than true. They are worth stating plainly, because the pages that publish streak tables without them are selling false precision.
It assumes trades are independent. They are not. Correlated positions — three USD pairs in the same direction, four altcoins on the same signal — resolve together, so a single wrong read produces four losses that the model counts as four independent events. Regimes cluster too: a strategy built for trending conditions will lose repeatedly through a range, and those losses arrive in a block. Real streaks run longer than the table says.
It assumes you know your win rate. You do not. You have an estimate from a finite sample. For an observed 45% win rate over 40 trades, one standard error is about ±7.9 percentage points (a rough 95% interval is about ±15.4 points). Every row in the table is therefore approximate for you specifically. Use it as a range, not a threshold.
Your historical worst streak is a low estimate. The longest streak in your journal is the worst you have seen so far, which is not the worst that exists. Sizing to survive only what has already happened is how accounts end.
A normal streak is not proof of an edge. This is the one that matters most. Passing the three checks means the streak has failed to disprove your strategy. It does not demonstrate the strategy makes money — a system with negative expectancy produces perfectly normal-looking losing streaks too, right up until the account is gone. Proving an edge is a separate question that needs a sample size, not a streak calculation.
The takeaway
You cannot avoid losing streaks. You can stop being surprised by them, which is most of the battle, because the damage in a drawdown usually comes from the reaction rather than the losses.
Do three things. Calculate the streak your win rate actually implies, so the number that arrives is one you have already seen. Track R-multiples and drawdown rather than consecutive losses, so you are measuring damage instead of a proxy for it. And write your stop-rule down while you are flat and calm, because the version you write while you are down 8% will be worse.
My stop rule when I suffer in a big loss streak is keeping a break. I used to have revenge tradings but this small shift changed my results. I need to step away from the charts and do nothing. This my best strategy for quitting a loosing streak.
A strategy that survives its own variance is worth more than one that looks better on paper and gets abandoned in week three.
Weekly Insights
One email a week on measuring trading performance. No account required.